
Published on:

In last month’s blog post, I introduced the idea of charting your caregiving experience. You can do this by creating a crude X- and Y- axis graph to plot out your care receiver’s health, and corresponding caregiving intensity, over the passage of time. In this post, I’ll explain how such a graph insightfully reveals when your caregiving experience requires a change in thinking.
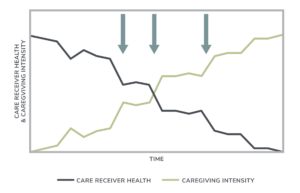
Charting the caregiving experience on a graph clearly illustrates the inverse relationship between the care receiver’s health condition and caregiving intensity. When the care receiver’s health is high, caregiving intensity is low. However, as the care receiver’s health decreases over time, caregiving intensity must increase to a corresponding degree.
Thus, the graph shows how the physical tasks of caregiving are directly impacted by the health condition of the care receiver. In caregiving, the needs of the care receiver always dictate what forms of physical assistance must be provided. Caregiving can be viewed as a process of ongoing adaptation to the evolving health conditions of the care receiver.
However, it is not only the physical tasks of caregiving that require adaptation by the caregiver. In order to successfully traverse through a protracted caregiving trajectory, the caregiver must adjust their mind to accommodate the emerging circumstances of the care receiver. This may involve mental, emotional, and cognitive adjustments that enable the caregiver to persist in an emerging and dynamic role in relationship to the care receiver.
Such cognitive adjustments usually occur gradually, almost imperceptibly, over the passage of time through a learning process I call the caregiver mindshift. Holistically, the caregiver mind shift is marked by three cognitive stages (disorientation, sense making, and reorientation) that loosely align with a person’s length of experience caregiving for a loved one.
While the caregiver mindshift model reflects a macro-level view of the caregiving experience, there are typically intermittent-level steps in adjusting one’s thinking over the larger course of the caregiver mind shift. A recognition of when and why such intermittent steps may be necessary can be helpful to family caregivers as well as the professionals who support them.
As a general rule, when there is a significant change in the care receiver’s health, and in the corresponding caregiving intensity, it becomes necessary for the caregiver to adapt to new circumstances. As mentioned above, the requisite adaptation may not be merely physical but also mental—which constitutes an important intermittent step in the caregiver mind shift.
This is where charting the caregiving experience, using the x- and y- graph of care receiver health and caregiving intensity, can be particularly revealing. Upon charting the care receiver’s health and caregiving intensity over time, periods of significant change are plainly manifested in the slope of the line. A steeper line indicates a greater change in caregiving intensity, implying that the caregiver may need to adapt not just physically but also mentally to the emerging circumstances of the care receiver. Such periods may be viewed as intermittent pivots or steps in the caregiver mind shift. In another post, I likened these intermittent steps to a car’s shifting of gears as it travels down the road.
If we consider the sample graphs used in last month’s post, we can clearly identify periods that likely require the caregiver to adapt the physical tasks of care and the way of thinking about care within the context of their relationship with the care receiver. I have included the sample graphs here, with one important addition: the big arrows. Each one marks an inflection point that may warrant the caregiver’s adjustments to approaching their care-oriented relationship with the care receiver. The big arrows are placed intermittently on each graph whenever there is a significant change in the slope of lines representing caregiving intensity and care receiver health.
The first graph represents a care receiver who is experiencing health-related challenges incidental to old age and frailty. This care receiver’s health follows a course of slow but steady decline, marked by occasional periods of acute care needs shown by the slope of lines representing care receiver health and caregiving intensity. During times of accelerated caregiving intensity, adjustments are optimally made not only to the physical tasks of care but also to the way the caregiver thinks about their evolving care-oriented relationship.
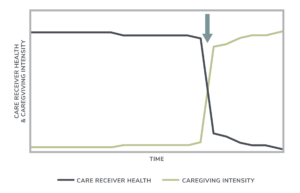
The second graph illustrates the case of a care receiver who was relatively healthy and faces death quickly after the sudden onset of a terminal illness. The dramatic change in the slope of the lines representing care receiver health and caregiving intensity suggest that the caregiver is forced to make major unexpected adjustments to a new reality defined by a life-threatening health condition. Successful navigation through such dramatic events requires not only a change in physical activities but also in the mental, emotional, and cognitive elements of a new care-oriented relationship.
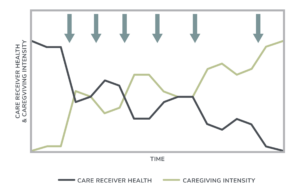
The third graph reflects the case of a care receiver who experiences intermittent, life-threatening episodes of acute sickness, followed by recurring recoveries, up through end of life. Note that in this graph, we see the “ups and downs” of care receiver health reflected in the rise and fall of the slope of the line—and big arrows marking transitional periods of both declining and improving health conditions. The roller-coaster of caregiving intensity in this example can be especially challenging to the caregiver, who may characterize their care receiver’s progression as a recurring pattern of “one step forward, two steps back.” The cognitive adjustments required by such a topsy-turvy care pattern can be especially disorienting.
Let’s move from hypothetical examples to your own personal experience. After drawing a graph showing the trajectory of your loved one’s health condition over time, with an overlay line representing caregiving intensity, take a look at the intervals of steeply sloped lines on your chart. Add (big) arrows wherever you see the heavily sloped line; these represent inflection points of change that probably warranted some cognitive adjustments to your ways of thinking about the caregiving experience. Such intermittent steps may be viewed as mileposts as you mentally traverse through the broad, macro-level caregiver mind shift.
I’ve proposed creating these graphs as a way for family caregivers and the professionals who support them to depict the physical and mental trajectory of care-related experience over time. Because the relationship between care receiver health and caregiving intensity is clear, a graphical visualization of the interplay between these two dynamic elements of caregiving can generate insights about the physical requirements of care as well as the cognitive adjustments that must be made to successfully continue in an emerging caregiver role. There are significant mental, emotional, familial, financial, and temporal implications to the family caregiver’s evolving circumstances. For this reason, graphing the caregiving experience is a worthwhile exercise, especially when done with an eye toward my other caregiving models to guide family caregivers over the course of protracted, long-term caregiving.
________________________________________________________________________________________________
If you’d like to invite Dr. Blight to lead a group discussion about the mental and emotional challenges of caregiving, please contact us.
Posted in Caregiving